> iris_bin1<-subset(iris, Species=='setosa'|Species=='versicolor’)
#setosa를 1로, setosa가 아닌 경우(versicolor)를 0으로 변경
> iris_bin1$Species<-ifelse(iris_bin1$Species=='setosa', 1, 0)
# iris_bin1에서 Sepal.Length와 Sepal.Width를 변수로 사용
> iris_bin1<-iris_bin1[, c(1, 2, 5)]
> index<-sample(2, nrow(iris_bin1), replace=T, prob=c(0.7, 0.3))
> train<-iris_bin1[index==1, ]
> test<-iris_bin1[index==2, ]
# 의사결정나무를 활용하여 ROC 커브 작성
> library(rpart)
> result<-rpart(Species~., data=train)
> pred<-predict(result, newdata=test)
> head(pred)
3 4 5 8 17 23
1 1 1 1 1 1
> test$pred<-pred
> head(test, 3)
Sepal.Length Sepal.Width Species pred
3 4.7 3.2 1 1
4 4.6 3.1 1 1
5 5.0 3.6 1 1
> library(Epi)
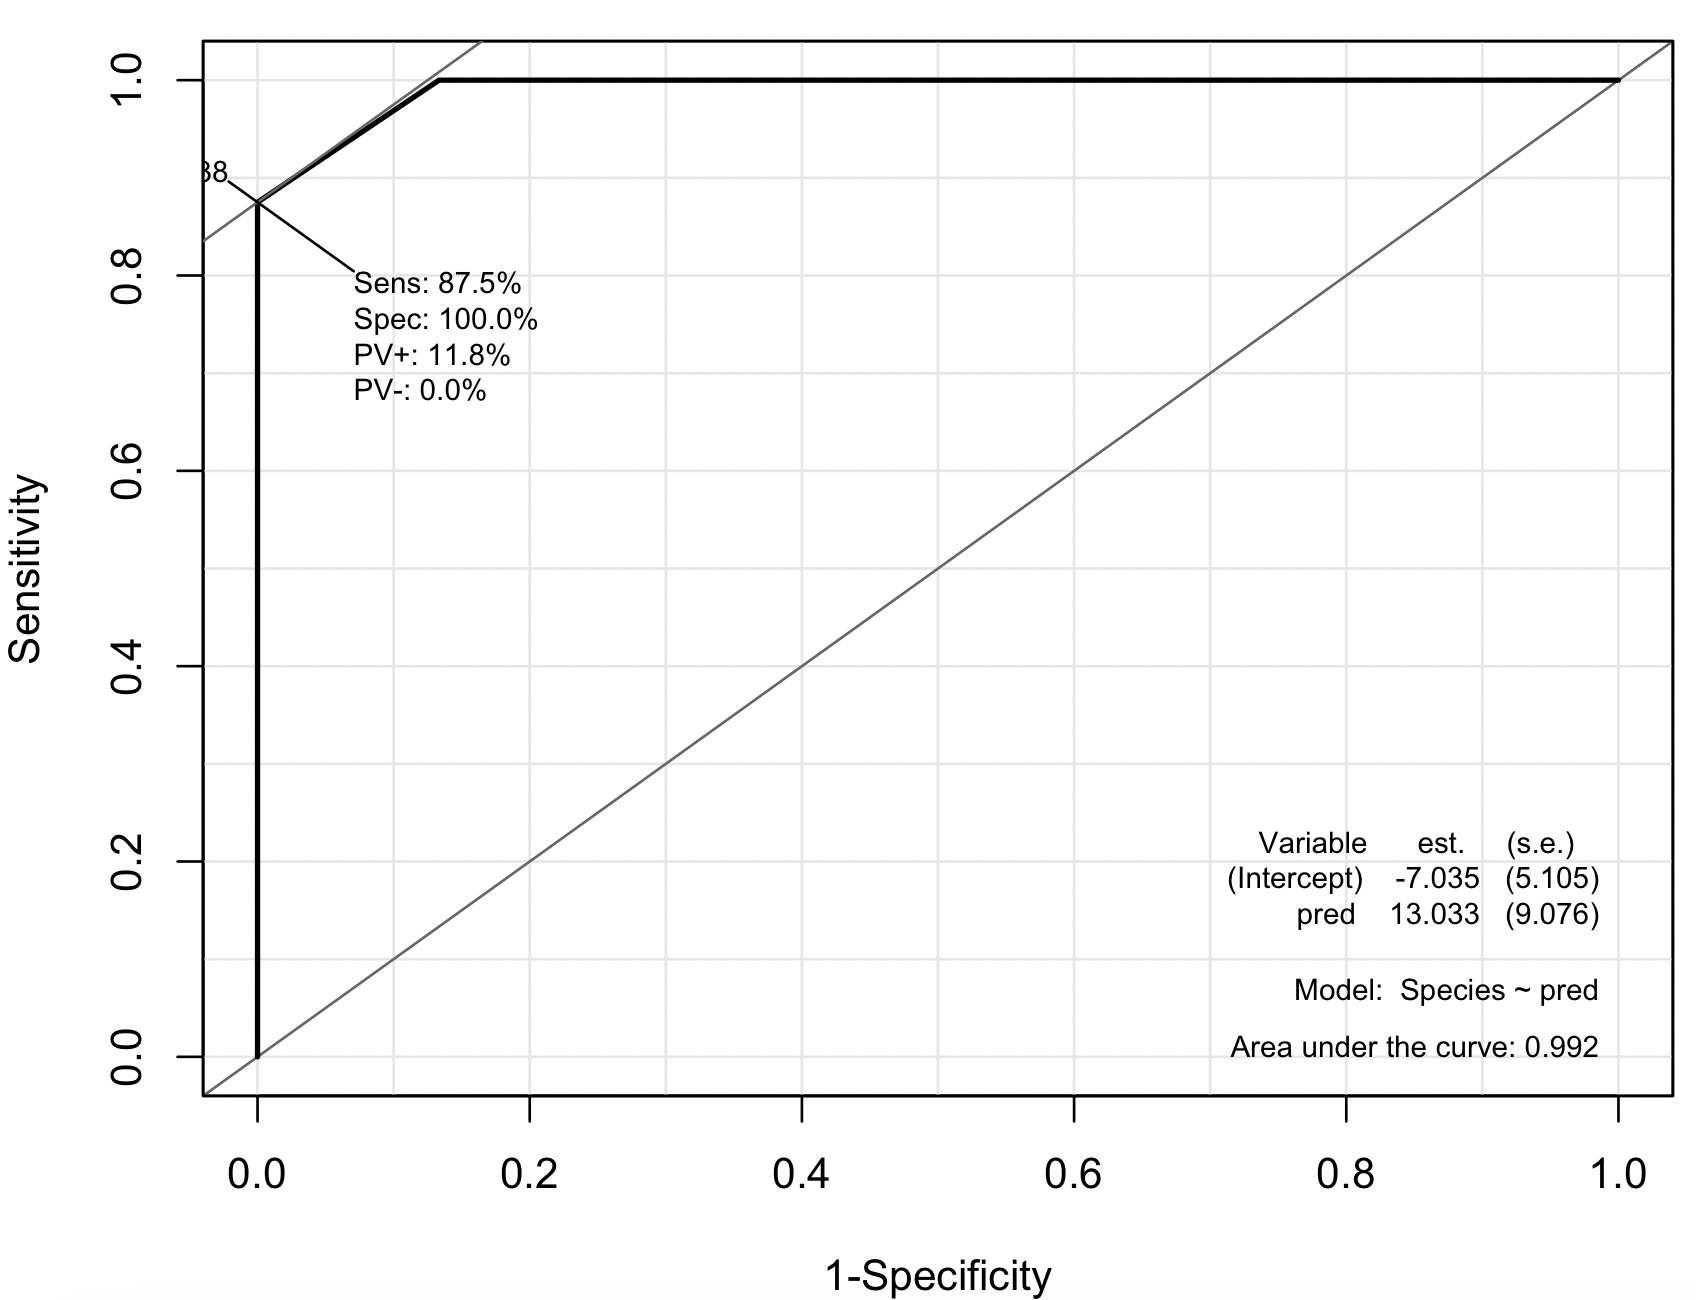
> ROC(form=Species~pred, data=test, plot='ROC')
